
Plant TPH Demand
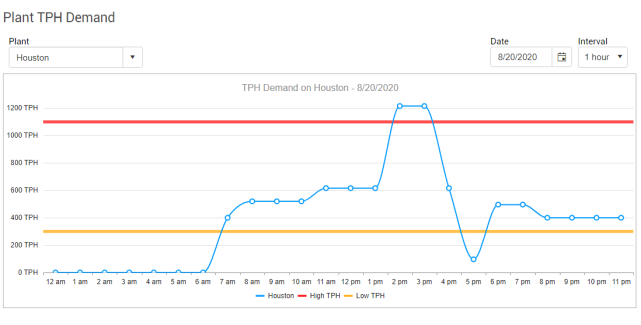
The Plant TPH Demand graph shows the scheduled TPH for a selected plant over the period of 24 hours.
- Go to Reports
- Click Plant TPH Demand on the left menu
- Select a Plant
- Select a Date
The plant's Min TPH and Max TPH will appear across the graph with the Max TPH showing in red, and the Min TPH showing in orange. Hover over the points for the plant's TPH on a particular hour.
Copyright © 2020 DropTime